Source code: https://github.com/yuen26/spring-boot-prometheus
1. Tìm hiểu nhanh về Prometheus
1.1. Prometheus là gì?
Prometheus là một open-source phục vụ việc giám sát (monitoring) và cảnh báo (alerting) dựa trên các thông số metrics. Prometheus được phát triển tại SoundCloud kể từ năm 2012 và đến nay đã được nhiều công ty và tổ chức sử dụng.
1.2. Kiến trúc của Prometheus

Prometheus là một hệ sinh thái gồm nhiều thành phần:
- Prometheus server: thu thập và lưu trữ dữ liệu dưới dạng time series.
- Client libraries: đây là API tương tác với Prometheus của các ngôn ngữ lập trình khác như Go, Java/Scala, Ruby, Python, ...
- Push Gateway: hỗ trợ các job có thời gian sống ngắn.
- Các exporter như HAProxy, StatsD, Graphite, ...
- Alertmanager: xử lý cảnh báo.
- Các công cụ hỗ trợ khác
Phần lớn các thành phần của Prometheus được viết bằng Go.
Từ mô hình kiến trúc trên, chúng ta có thể thấy Prometheus hoạt động khá giống theo ETL flow:
- Extract: Prometheus đầu tiên sẽ thu thập dữ liệu metrics từ các job: trực tiếp từ các target (nguồn cung cấp metrics) hoặc thông qua Push Gateway.
- Transform: Prometheus lưu trữ các dữ liệu thu thập được ở local. Sau đó chạy các rule trên tập dữ liệu này để tổng hợp và lưu thành dữ liệu time series.
- Load:
- Visualization: các tool như Prometheus web UI hoặc Grafana sử dụng PromQL để truy vấn dữ liệu từ Prometheus server và hiển thị trực quan dữ liệu.
- Alerting: Alertmanager tiến hành gửi cảnh báo thông qua các kênh như email.
1.3. Các khái niệm chính
Mô hình dữ liệu
Như chúng ta đã biết, Prometheus lưu trữ dữ liệu metrics đầu vào dưới dạng time series.
Một time series được định danh bởi tên của metrics và các label:
- Tên của metric: chỉ ra đặc tính cần đo lường trong hệ thống. Ví dụ: http_requests_total => tổng số HTTP request nhận được.
- Label: là một cặp key-value, xác định một dimension của dữ liệu. PromQL sẽ dựa trên các dimension để lọc và tổng hợp dữ liệu. Ví dụ: với metrics http_requests_total, chúng ta có thể có 2 label là method="POST", handler="/messages"
Các metric type
Prometheus hỗ trợ 4 metric type là:
- Counter
- Gauge
- Histogram
- Summary
Các bạn có thể tham khảo thêm về 4 metric type trên tại đây.
Job và Instance
- Instance: một endpoint mà Prometheus có thể thu thập dữ liệu metrics, tương ứng với một single process.
- Job: tập hợp các instance có chung mục đích.
Ví dụ:
- job: api-server
- instance 1: 1.2.3.4:5670
- instance 2: 1.2.3.4:5671
- instance 3: 5.6.7.8:5670
- instance 4: 5.6.7.8:5671
2. Xây dựng một ứng dụng Spring Boot demo
Ứng dụng của chúng ta rất đơn giản. Mục đích duy nhất của ứng dụng là public một API cung cấp metrics cho Prometheus.
2.1. Dependencies
Spring Boot Actuator không cung cấp sẵn endpoint cho Prometheus. Vì vậy chúng ta cần phải đăng ký Prometheus với Spring Boot Actuator thông qua Micrometer Registry.
pom.xml
<?xml version="1.0" encoding="UTF-8"?>
<project xmlns="http://maven.apache.org/POM/4.0.0" xmlns:xsi="http://www.w3.org/2001/XMLSchema-instance"
    xsi:schemaLocation="http://maven.apache.org/POM/4.0.0 http://maven.apache.org/xsd/maven-4.0.0.xsd">
    <modelVersion>4.0.0</modelVersion>
    <parent>
        <groupId>org.springframework.boot</groupId>
        <artifactId>spring-boot-starter-parent</artifactId>
        <version>2.1.6.RELEASE</version>
        <relativePath/> <!-- lookup parent from repository -->
    </parent>
    <groupId>com.example</groupId>
    <artifactId>app</artifactId>
    <version>0.0.1-SNAPSHOT</version>
    <name>app</name>
    <description>Demo project for Spring Boot</description>

    <properties>
        <java.version>1.8</java.version>
    </properties>

    <dependencies>
        <dependency>
            <groupId>org.springframework.boot</groupId>
            <artifactId>spring-boot-starter-actuator</artifactId>
        </dependency>

        <dependency>
            <groupId>io.micrometer</groupId>
            <artifactId>micrometer-registry-prometheus</artifactId>
            <version>1.1.5</version>
        </dependency>

        <dependency>
            <groupId>org.springframework.boot</groupId>
            <artifactId>spring-boot-starter-web</artifactId>
        </dependency>

        <dependency>
            <groupId>org.springframework.boot</groupId>
            <artifactId>spring-boot-starter-test</artifactId>
            <scope>test</scope>
        </dependency>
    </dependencies>

    <build>
        <plugins>
            <plugin>
                <groupId>org.springframework.boot</groupId>
                <artifactId>spring-boot-maven-plugin</artifactId>
            </plugin>
        </plugins>
    </build>

</project>
2.2. Expose Prometheus endpoint
Trong application.properties, chúng ta bổ sung property sau để expose Prometheus endpoint:
management.endpoints.web.exposure.include=*
2.3. Dockerfile
Dockerfile
FROM openjdk:8u171-jdk-alpine3.8
COPY target/app-0.0.1-SNAPSHOT.jar /app.jar
CMD ["java", "-jar", "app.jar"]
2.4. Build
Đầu tiên, chúng ta dùng lệnh mvn clean install để build ứng dụng thành file JAR.
Sau đó truy cập vào địa chỉ http://localhost:8080/actuator, chúng ta sẽ thấy lúc này Spring Boot Actuator đã expose Prometheus endpoint:
"prometheus": {
    "href": "http://localhost:8080/actuator/prometheus",
    "templated": false
}
Endpoint http://localhost:8080/actuator/prometheus cung cấp một list các metrics tại thời điểm hiện tại của hệ thống:
# HELP tomcat_sessions_active_current_sessions
# TYPE tomcat_sessions_active_current_sessions gauge
tomcat_sessions_active_current_sessions 0.0
# HELP jvm_buffer_count_buffers An estimate of the number of buffers in the pool
# TYPE jvm_buffer_count_buffers gauge
jvm_buffer_count_buffers{id="direct",} 10.0
jvm_buffer_count_buffers{id="mapped",} 0.0
# HELP logback_events_total Number of error level events that made it to the logs
# TYPE logback_events_total counter
logback_events_total{level="warn",} 0.0
logback_events_total{level="debug",} 0.0
logback_events_total{level="error",} 0.0
logback_events_total{level="trace",} 0.0
logback_events_total{level="info",} 7.0
# HELP jvm_gc_pause_seconds Time spent in GC pause
# TYPE jvm_gc_pause_seconds summary
jvm_gc_pause_seconds_count{action="end of major GC",cause="Metadata GC Threshold",} 1.0
jvm_gc_pause_seconds_sum{action="end of major GC",cause="Metadata GC Threshold",} 0.079
jvm_gc_pause_seconds_count{action="end of minor GC",cause="Metadata GC Threshold",} 1.0
jvm_gc_pause_seconds_sum{action="end of minor GC",cause="Metadata GC Threshold",} 0.015
jvm_gc_pause_seconds_count{action="end of minor GC",cause="Allocation Failure",} 3.0
jvm_gc_pause_seconds_sum{action="end of minor GC",cause="Allocation Failure",} 0.038
# HELP jvm_gc_pause_seconds_max Time spent in GC pause
# TYPE jvm_gc_pause_seconds_max gauge
jvm_gc_pause_seconds_max{action="end of major GC",cause="Metadata GC Threshold",} 0.0
jvm_gc_pause_seconds_max{action="end of minor GC",cause="Metadata GC Threshold",} 0.0
jvm_gc_pause_seconds_max{action="end of minor GC",cause="Allocation Failure",} 0.0
# HELP system_cpu_count The number of processors available to the Java virtual machine
# TYPE system_cpu_count gauge
system_cpu_count 4.0
...
3. Cấu hình Prometheus
Chúng ta sẽ cấu hình một job có tên là app-metrics trong file prometheus.yml:
prometheus.yml
scrape_configs:
  - job_name: 'app-metrics'
    metrics_path: '/actuator/prometheus'
    scrape_interval: 5s
    static_configs:
      - targets: ['app:8080']
Trong đó:
- scrape_interval: 5s => cứ 5 giây, Prometheus server sẽ thu thập metrics từ endpoint http://localhost:8080/actuator/prometheus một lần.
- Vì chúng ta sẽ sử dụng Docker Compose để chạy Spring Boot app, Prometheus và Grafana cùng với nhau, nên thay vì chỉ ra địa chỉ IP hoặc host name của Spring Boot app trong targets, chúng ta sẽ sử dụng container name của Spring Boot app để thay thế.
Các bạn có thể tham khảo thêm về cấu hình Prometheus tại đây.
4. Grab all
4.1. docker-compose.yml
docker-compose.yml
version: '3'
services:
app:
build: ./app
ports:
- "8080:8080"
container_name: app
prometheus:
image: "prom/prometheus"
volumes:
- ./prometheus.yml:/etc/prometheus/prometheus.yml
ports:
- "9090:9090"
container_name: prometheus
grafana:
image: "grafana/grafana"
ports:
- "3000:3000"
container_name: grafana
Chạy lệnh docker-compose build để chạy Spring Boot app, Prometheus và Grafana cùng với nhau.
Để kiểm tra xem Prometheus đã kết nối với ứng dụng Spring Boot thành công hay chưa, chúng ta sẽ vào địa chỉ http://localhost:9090/targets. Nếu state là UP thì chứng tỏ kết nối thành công:

4.2. Prometheus web UI
Prometheus đã cung cấp sẵn một web UI để hiển thị dữ liệu trực quan.
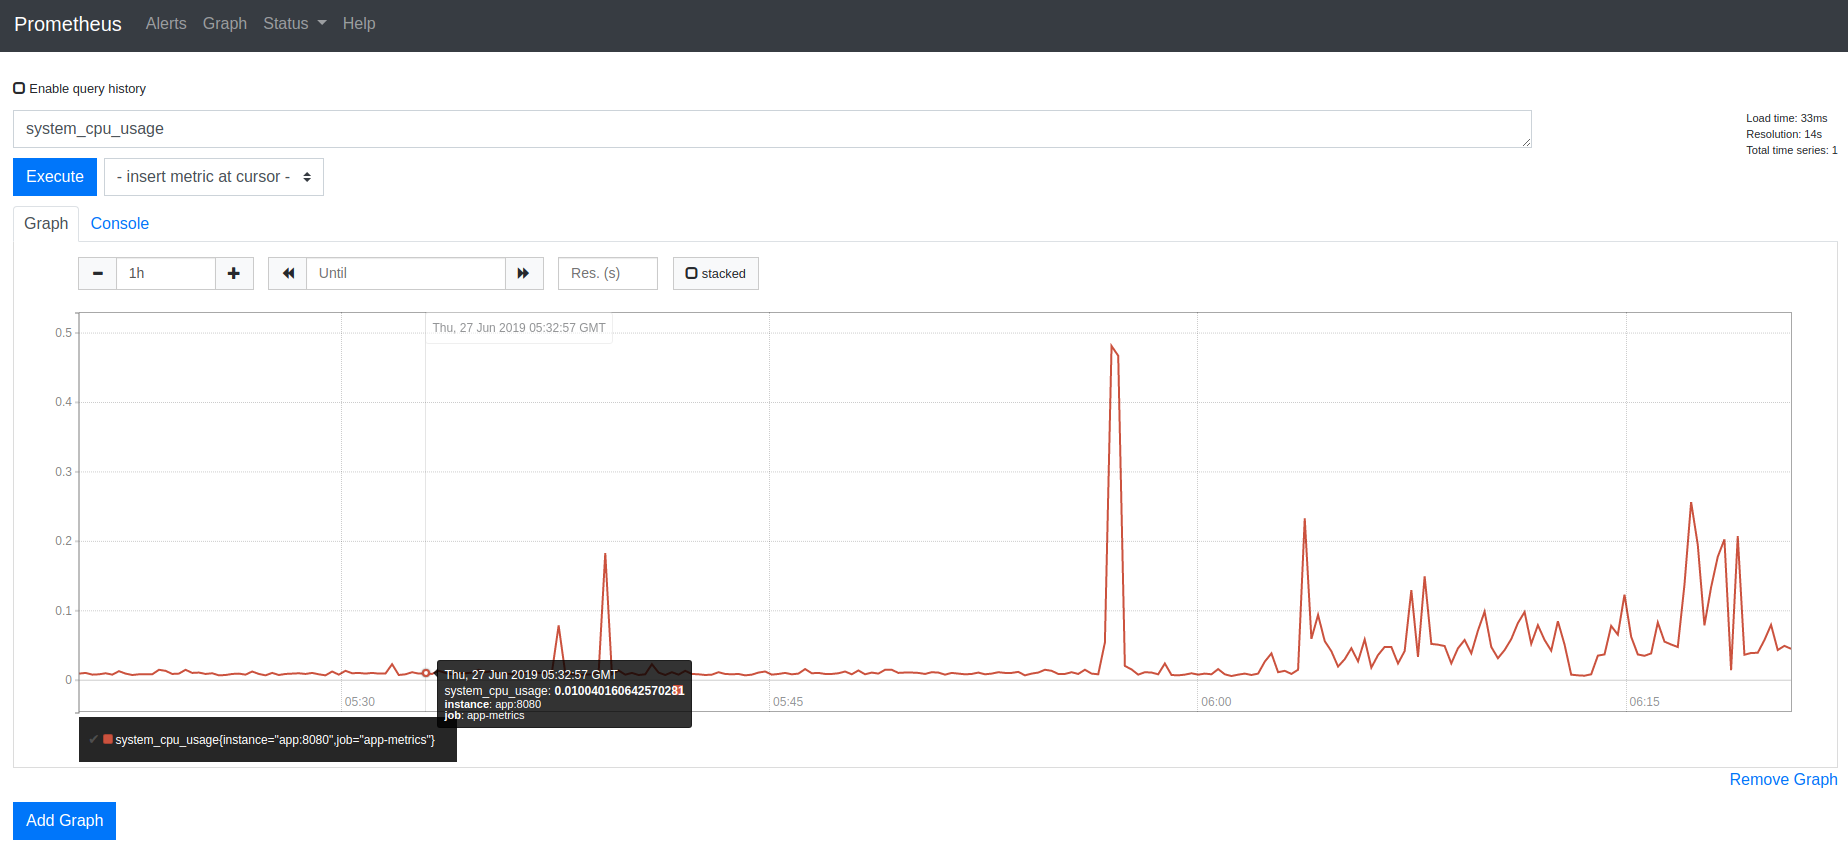
Truy cập Prometheus web UI tại địa chỉ http://localhost:9090/graph.
Sau đó nhập text system_cpu_usage rồi click button Execute. Mở tab Graph, chúng ta sẽ thấy một đồ thị Gauge biểu diễn phần trăm CPU được sử dụng theo thời gian:
4.3. Grafana
Nếu Prometheus web UI vẫn chưa đáp ứng được nhu cầu thì các bạn có thể sử dụng Grafana.
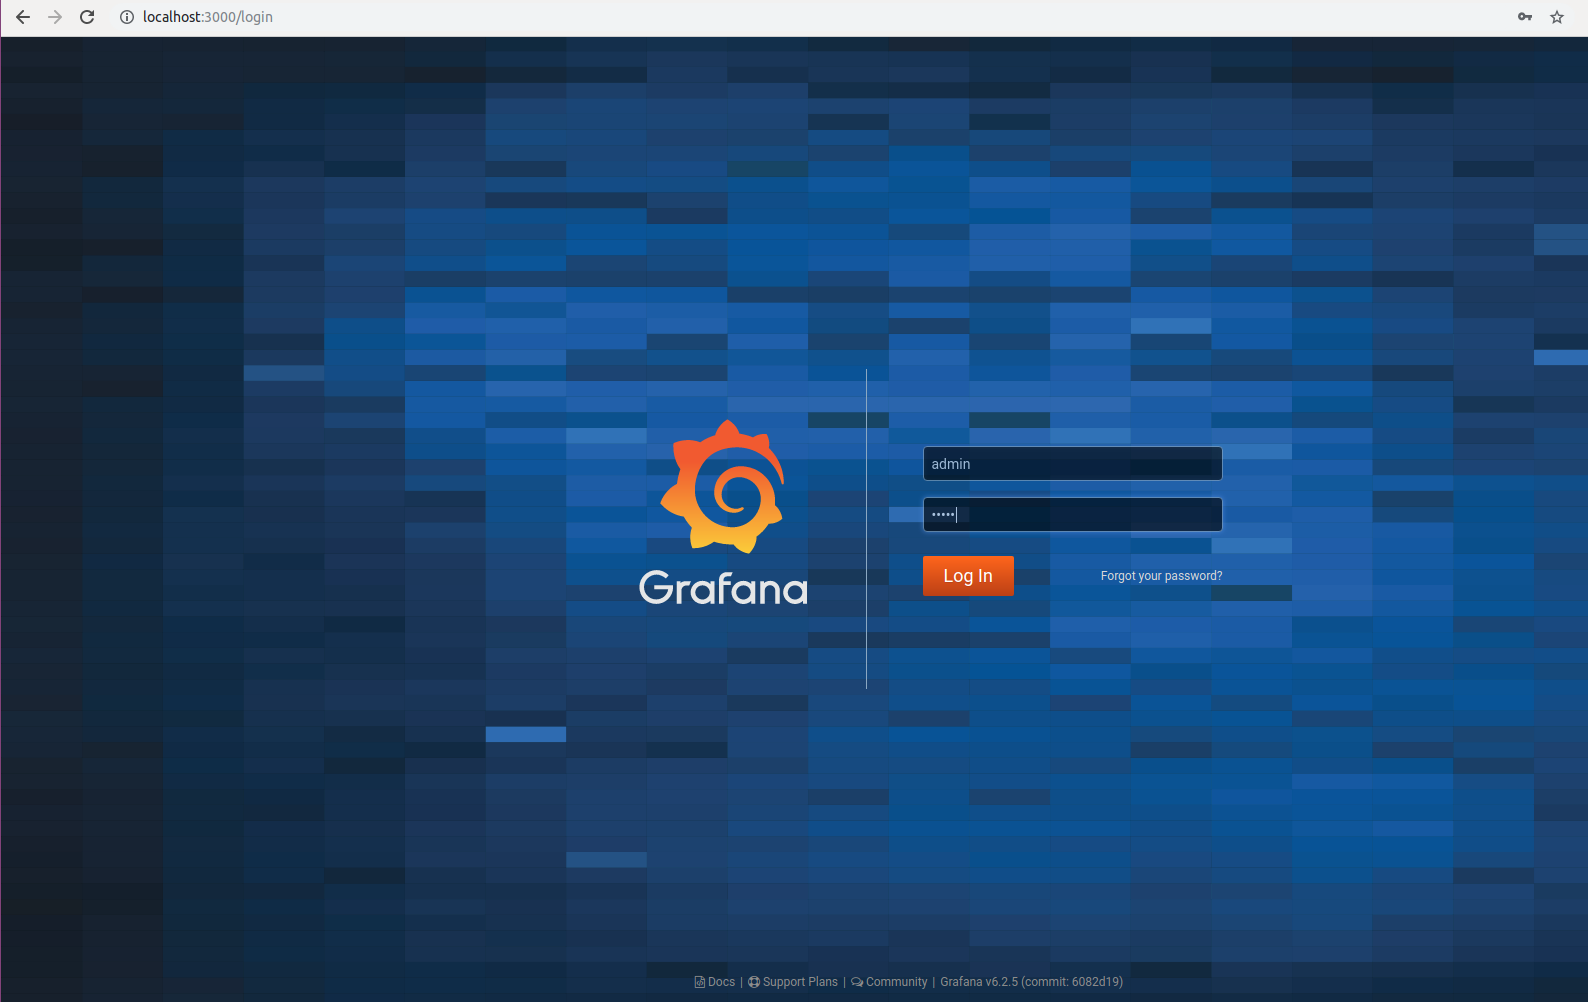
Bước 1: Đăng nhập vào Grafana dashboard
Truy cập vào Grafana dashboard tại địa chỉ http://localhost:3000. Nếu là lần đầu truy cập, Grafana sẽ yêu cầu đăng nhập. Chúng ta sẽ nhập username/password mặc định là admin/admin:
Sau khi đăng nhập thành công, Grafana sẽ hỏi chúng ta có đổi mật khẩu hay không. Bạn có thể click Skip để bỏ qua bước này.
Bước 2 Thêm data source
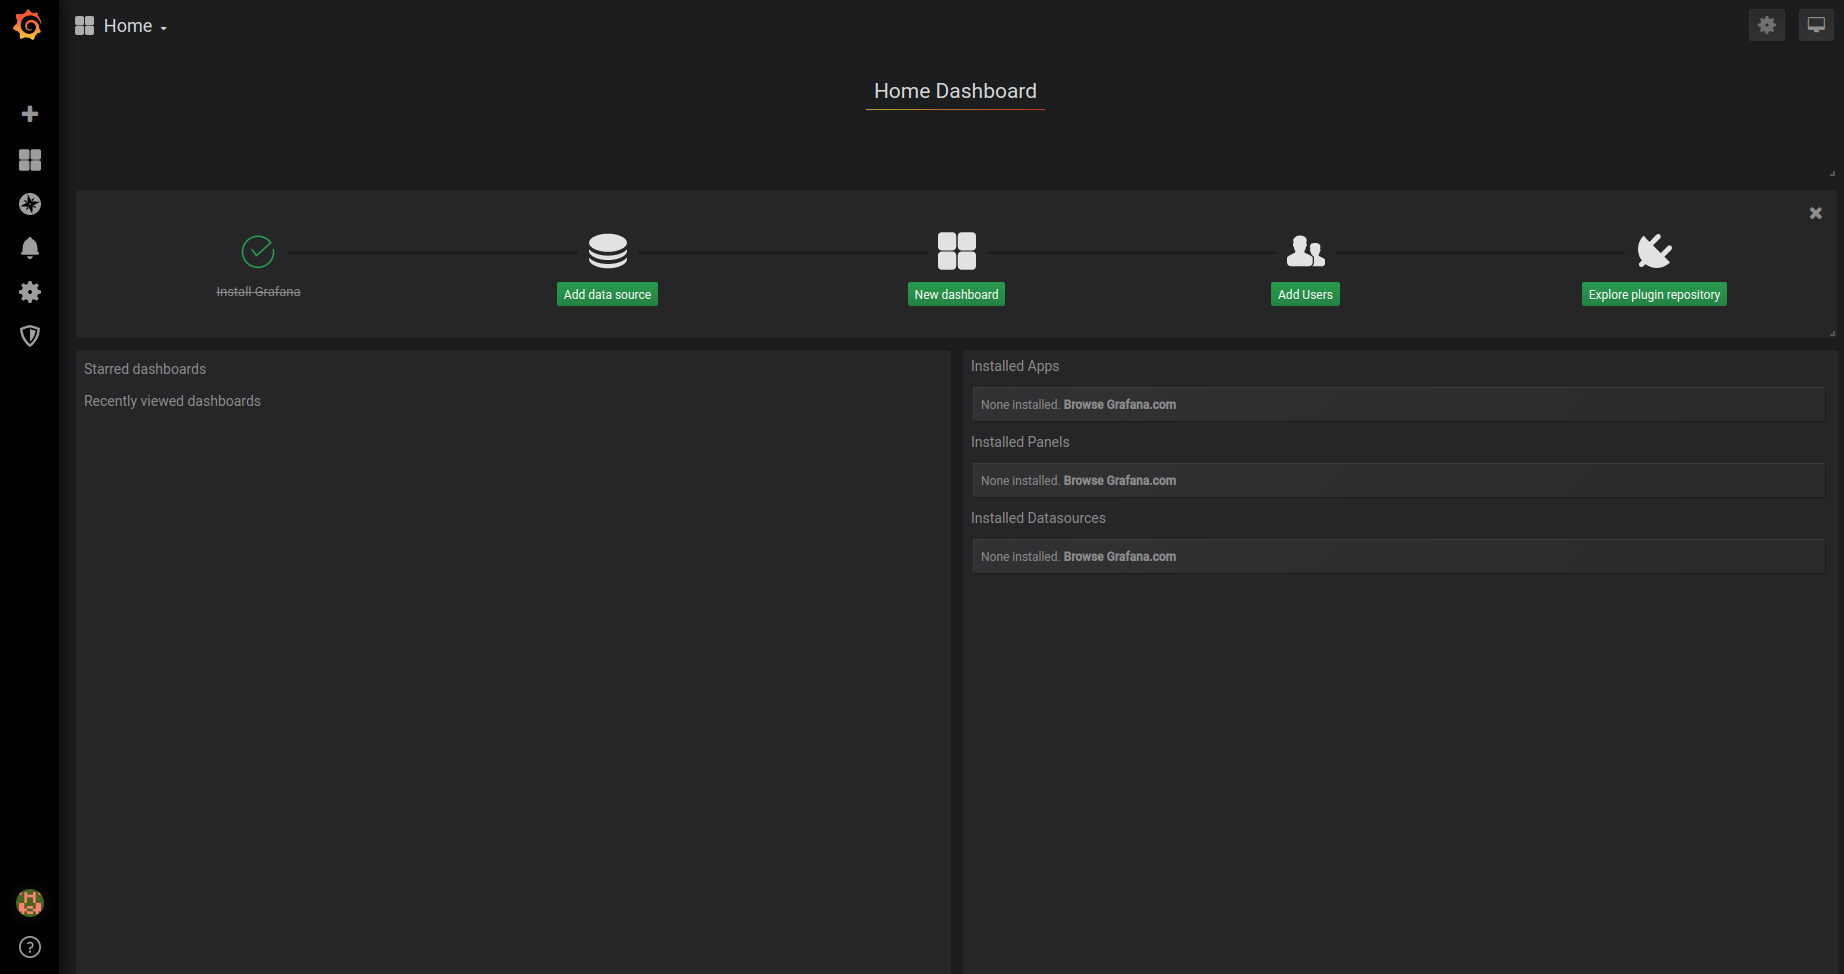
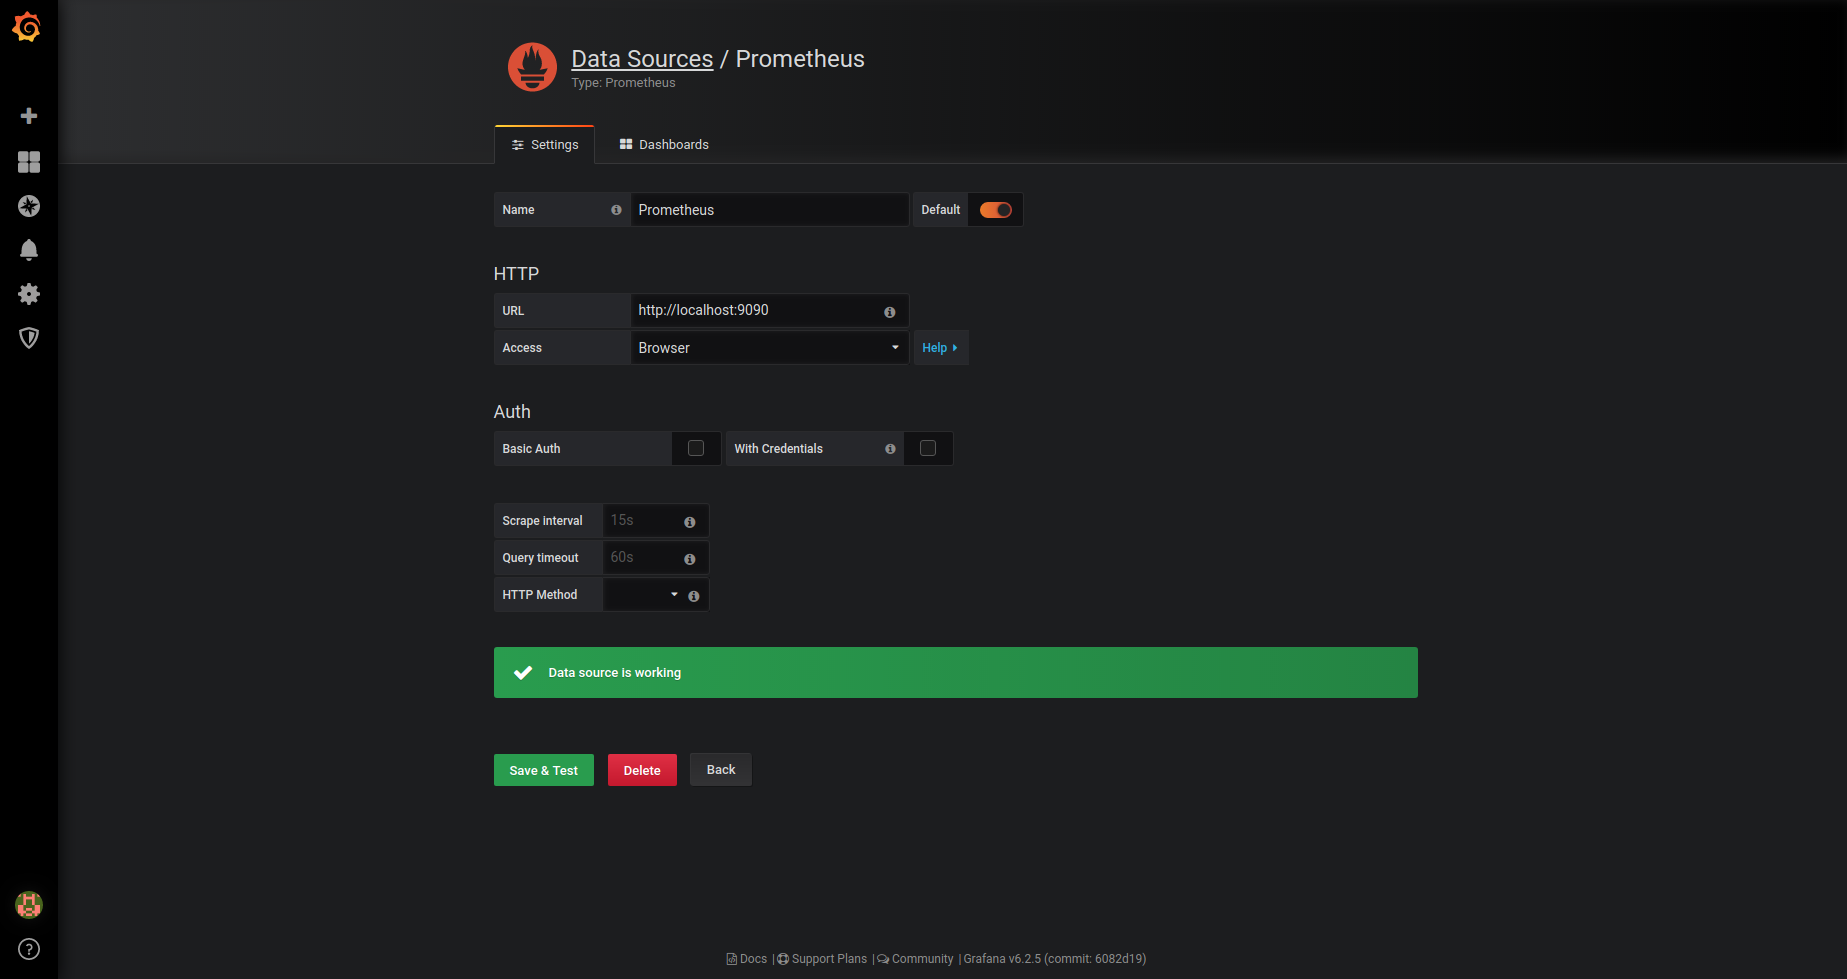
Click button Add data source. Sau đó chọn biểu tượng của Prometheus.

Ở mục HTTP, nhập URL của Prometheus web UI và chọn Access là Browser:
Trở về Grafana dashboard tại địa chỉ http://localhost:3000.
Bước 3: Tạo dashboard

Click button New dashboard sau đó chọn Add query:

Thử nhập text system_cpu_usage. Ở góc phải trên, chọn time range là Last 5 minutes và refresh time là 5s. Click ra một vùng bất kỳ, chúng ta sẽ thấy đồ thị Gauge như dưới:
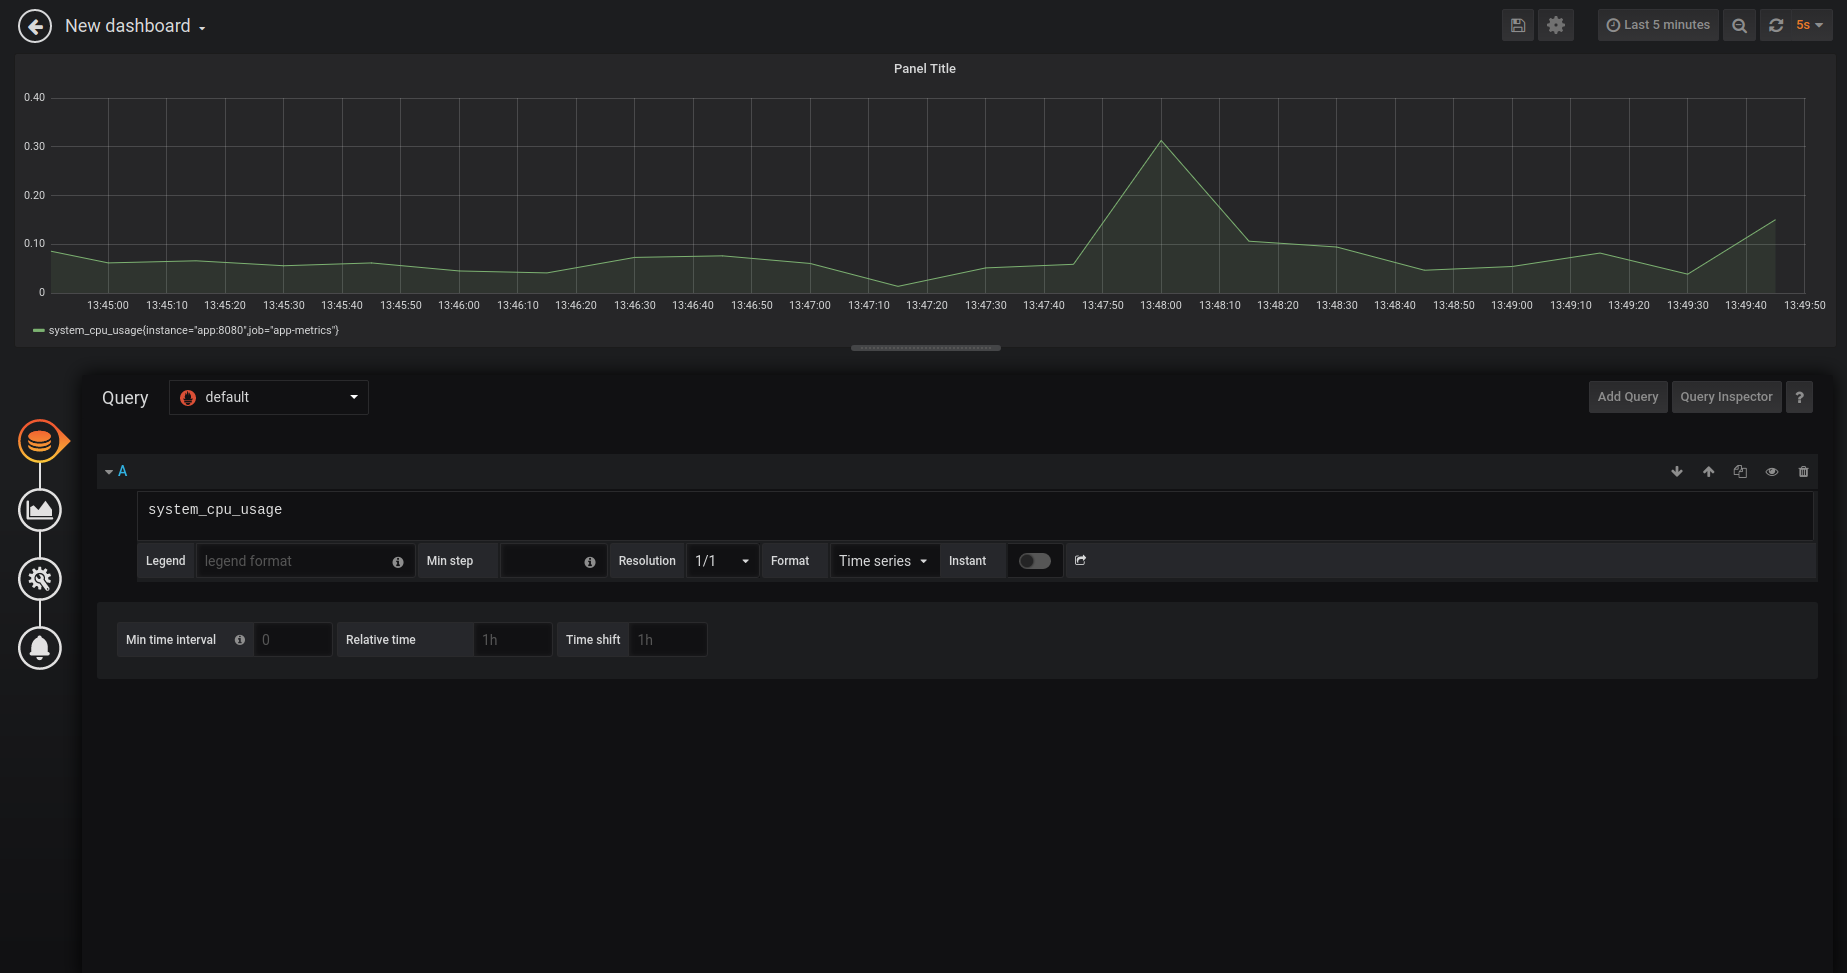
Về mặt giao diện có thể thấy Grafana đẹp và ngầu hơn hẳn Prometheus web UI :D
Để lưu dashboard, chúng ta click nút Save dashboard ở góc phải trên.
4. Custom Prometheus Metrics
Trong một số ứng dụng có kết nối với DB, chúng ta đôi khi mong muốn có một metrics để check kiểm tra kết nối đến DB. Lúc này chúng ta sẽ tạo một bean MeterRegistryCustomizer:
import org.springframework.beans.factory.annotation.Autowired;
import org.springframework.boot.SpringApplication;
import org.springframework.boot.actuate.autoconfigure.metrics.MeterRegistryCustomizer;
import org.springframework.boot.actuate.health.Health;
import org.springframework.boot.actuate.health.HealthEndpoint;
import org.springframework.boot.autoconfigure.SpringBootApplication;
import org.springframework.context.annotation.Bean;
@SpringBootApplication
public class AppApplication {
@Autowired
private HealthEndpoint healthEndpoint;
@Bean
public MeterRegistryCustomizer dbHealth() {
return registry -> registry.gauge("db_health", healthEndpoint, healthEndpoint -> {
Health dbHealth = (Health) healthEndpoint.health().getDetails().get("db");
return (int) dbHealth.getDetails().get("hello");
});
}
public static void main(String[] args) {
SpringApplication.run(AppApplication.class, args);
}
}
Trong đó:
- Metrics có tên là
db_healthvà có kiểu là Gauge. - Để biết ứng dụng có kết nối được đến DB hay không, chúng ta sẽ dựa theo node
details.db.details.hellocủa endpoint/actuator/health. Nếu bằng 1 thì kết nối thành công, còn bằng 0 thì kết nối không thành công.
{
"status": "UP",
"details": {
"db": {
"status": "UP",
"details": {
"database": "PostgreSQL",
"hello": 1
}
},
...
}
}
- Để endpoint
/healthshow được details, chúng ta cần thêm propertymanagement.endpoint.health.show-details=always.
Chạy lại ứng dụng, trong http://localhost:8080/actuator/prometheus, chúng ta sẽ thấy:
# HELP db_health
# TYPE db_health gauge
db_health 1.0Tài liệu tham khảo
https://www.callicoder.com/spring-boot-actuator-metrics-monitoring-dashboard-prometheus-grafana/
Link bài viết gốc tại đây
Bài viết được đăng tải lại dưới sự cho phép của tác giả - Thầy Nguyễn Tuấn Anh là giảng viên Khoá Lộ trình Java Spring Boot Full Stack
Bình luận